In foodservice swift, accurate, and impactful decision-making is crucial, and data visualization serves as a cornerstone in this process.
Foodservice operations generate an immense volume of data—supplier details, inventory records, sales figures, and more. Data visualization acts as a translator, converting these complex datasets into intuitive visuals.
This transformation of intricate data into visual representations not only simplifies the complexities inherent in foodservice operations but also empowers decision-makers with actionable insights. By harnessing the power of data visualization, operators gain a clearer understanding of their business landscape, enabling informed strategies that drive efficiency, profitability, and customer satisfaction.
From uncovering supplier performance variations to analyzing consumer behavior trends, data visualization serves as the compass guiding operators through the nuances of the industry. Let’s dive deeper into the significant role data visualization plays in unlocking the potential within foodservice data.
What is data visualization?
Data visualization involves presenting data and information in graphical form. Data visualization tools offer an easy-to-use means of seeing and comprehending trends, outliers, and patterns in data. This is accomplished through the use of visual elements like charts, graphs, and maps.
Simply put, it’s the art of transforming your complex purchasing data into easy-to-understand visuals. Think colorful graphs, charts, and maps that unveil the story hidden within your numbers.
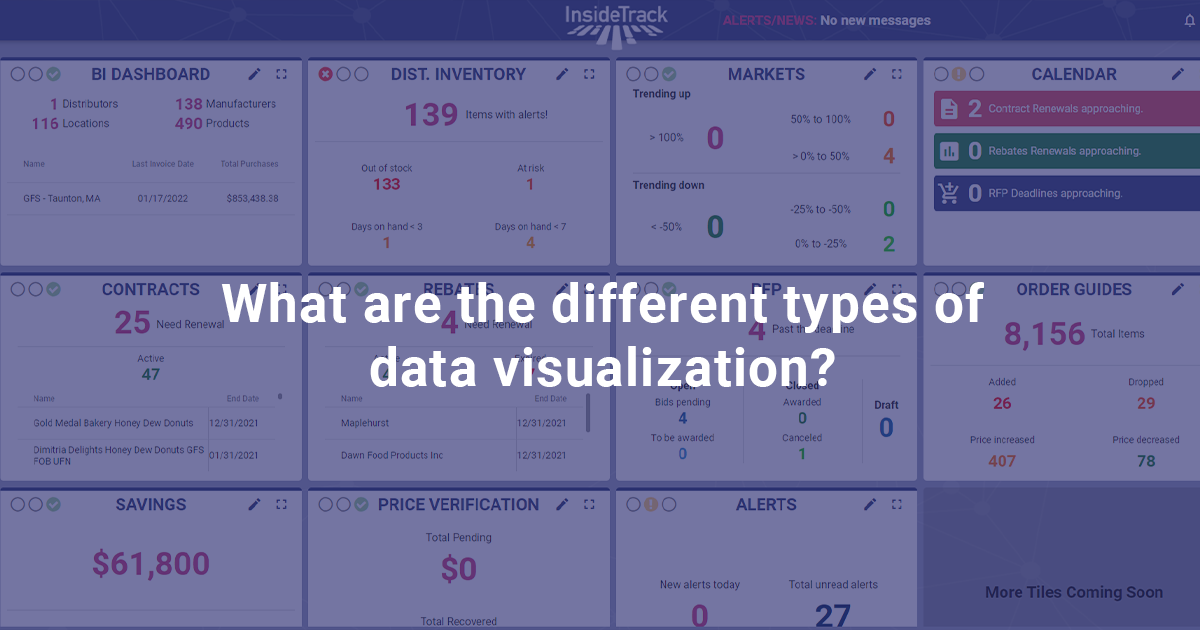
What are the different types of data visualization?
Exploring various types of visualization reveals a spectrum of options tailored to convey information effectively. Examples include:
- Bar Graphs & Column Charts: Suitable for comparing categories or showing changes over time.
- Pie Charts: Display parts of a whole, great for illustrating proportions.
- Line Charts: Demonstrate trends over time or continuous data.
- Heatmaps: Visualize data density or relationships using colors.
- Maps & Geospatial Visualizations: Show data across geographical locations.
Each visualization type holds its unique power in conveying information, making it crucial to choose the right one based on the nature and purpose of your data.
What are the benefits of data visualization?
Understanding consumer preferences, market demands, and seasonal fluctuations is vital. Visualization tools like line graphs and bar charts become the compass, guiding foodservice operators through these trends. They uncover hidden patterns, enabling timely adjustments in menu offerings, procurement strategies, and resource allocation. Benefits of leveraging data visualization include:
- Clarity: Simplifies complex data, enhancing comprehension.
- Insightful Trends: Reveals patterns and trends that might be obscured in raw data.
- Informed Decision-Making: Provides clear insights for making strategic and informed decisions.
- Efficient Communication: Facilitates seamless communication of insights to stakeholders, fostering better collaboration and understanding.
These benefits underscore the pivotal role of data visualization in amplifying understanding, efficiency, and informed decision-making within foodservice operations.
After uncovering the substantial benefits of data visualization, let’s unveil a practical tool that enables foodservice operators to harness these advantages effectively: InsideTrack.
Data Visualization Solutions with InsideTrack
InsideTrack uses specialized capture techniques that consolidate data from multiple sources and organize purchases based on description, category, location, time frame, vendor, and price trends. This comprehensive view is conveniently presented through dedicated client dashboards.
Unveiling the potential within your data becomes effortless with InsideTrack. You can explore the myriad benefits of data visualization, leveraging InsideTrack’s tools to navigate their information landscape effectively. Here are some of the actionable insights you can dive into:
Price Trend Analysis: Uncover patterns and fluctuations in pricing over time, aiding in strategic procurement decisions and cost management.
Budgeting Tools: Streamline budget allocation and track expenditures effectively, ensuring fiscal responsibility and optimal resource allocation.
Price and Volume Variance: Identify deviations in pricing and volume metrics, facilitating precise adjustments for operational efficiency.
Descending Dollar Reporting: Pinpoint high-impact expenditure areas, allowing for targeted cost-saving measures and enhanced profitability.
Each tool within InsideTrack opens doors to deeper understanding and informed decision-making, enabling foodservice operators to transform their data into a strategic advantage.
InsideTrack goes beyond conventional data management. It provides a detailed breakdown of every item on every invoice, resembling a digitized and easily searchable filing system for procurement teams. Beginning with simplified data visualization, operators gain a holistic view of their spending. Then, through deeper exploration, they can uncover specific categories, items, suppliers, and distributors that significantly impact margins. This detailed insight enables precise decision-making to optimize procurement strategies and drive profitability.