Not to brag or anything but for those of you who don’t know us, or if this is your first time on our site, we are THE procurement technology for the hospitality industry.
We know best procurement negotiations and practices that are driven by high-quality data.
With that being said, we wanted to share a little insight into the Price & Market Trend Widget, one of the many features offered with InsideTrack.
This report is super useful when it comes to category management.
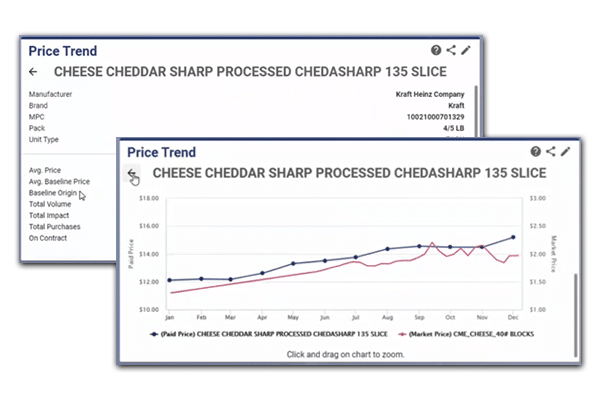
The report shows operators a comparison of prices paid for the same product bought this year, this month or this quarter versus last. It provides a picture of how those priced fluctuated for the same product and what the impact for that price fluctuation has on your major categories.
Operators can group spend by major categories. You can see how those categories are fluctuating, price increases on all the products that are impacting your customer locations or if you manufacture products.
What you’ll see in this report is a total overall impact. For example, let’s say an operator purchased refrigerated products for an specific amount in 2019 and now a higher amount in 2020. The report will show you just how much that price increased and how the increase is impacting your categories in the current year.
Now that you see the overall prices of your refrigerated products have increased, you can now use the report to break down products within that category. Take cheese for example. Once you click into the specific cheese product, you can see details such as the manufacturer, brand, product code, pack size, and unit type.
Another great feature you get access to as an InsideTrack member, you get access to over 9000 USDA Commodity markets and the ability to customize those markets.
Depending on the product mix you’re buying, what your top products, and what you want to keep an eye on, you have the ability to go into the report, type in the product and get the market reports for that specific product you are searching for.
Having access to these reports helps you justify the increase or decrease in costs.

The report puts everything you need to know right at your fingertips. If market prices are going up or down, this report arms you with information that you can take back to the distributor.
It gives you a few different avenues to look at items you’re buying this month versus last month or this year versus last year and how they are impacting different categories.
What is also nice? If you negotiate a program with certain manufacturers with certain products, or you get put on a program like a GPO program, you’re able to measure the effectiveness from when you weren’t on those programs to the difference being on that program has had on your operations spend management.
You can view a live demo of the Price & Market Trend Widget by watching the Master User Goup “MUG” session below.
Check out insight from InsideTrack Master User Bryan Edwards, Sr. Director Supply Chain and Logistics at Xanterra Travel Collection HERE!
InsideTrack is here to audit your prices, find your operation savings, see how your prices trend over time and how they impact costs by category or by individual products. Contact us today!


