

Foodservice procurement teams make decisions every day that affect costs, inventory, supplier relationships, and ultimately, the financial performance of the operation. But knowing whether those decisions are actually working takes more than looking at total spend at the end of the month.
That’s where procurement KPIs come in.
The right procurement KPIs help operators understand what’s happening behind their purchasing numbers. Are contracted prices showing up correctly on invoices? Are suppliers consistently filling orders? How much spend is actually being managed? Are rebates being captured? And where are unexpected costs starting to creep in?
For foodservice organizations managing multiple suppliers, distributors, locations, and contracts, those answers can be difficult to find without a consistent way to measure performance.
Tracking the right procurement KPIs gives teams a clearer picture of where purchasing is working, where it isn’t, and where there may be an opportunity to improve.
Why Procurement KPIs Matter More in Foodservice
Foodservice purchasing has a lot of moving pieces.
Prices fluctuate. Product availability changes. Distributors make substitutions. Locations may purchase outside of approved programs. Credits can get missed. Contracted pricing doesn’t always match what appears on an invoice.
Individually, those issues might not look significant. Across dozens or hundreds of locations, they can add up quickly.
Procurement KPIs give operators a way to spot those patterns before they become larger problems. Instead of relying solely on a monthly P&L or broad food cost percentage, procurement teams can look deeper into what is driving the numbers.
That visibility also makes conversations with suppliers and distributors more productive. Rather than saying costs feel high or service seems inconsistent, teams can point to the numbers and identify exactly where performance needs attention.
How to Choose Procurement KPIs That Align with Your Business Goals
There isn’t one perfect list of procurement KPIs that every foodservice organization should track.
A restaurant group trying to reduce purchasing costs may care most about price variance and contract compliance. An organization struggling with product availability may focus more heavily on fill rates and emergency purchases. A procurement team managing a large supplier network may prioritize supplier performance.
Start with the business problem you’re trying to solve.
From there, choose a manageable group of procurement KPIs that helps answer the questions behind that problem. Tracking dozens of numbers simply because the data exists can create more noise than insight.
The goal isn’t to measure everything. It’s to measure what gives your team something useful to act on.
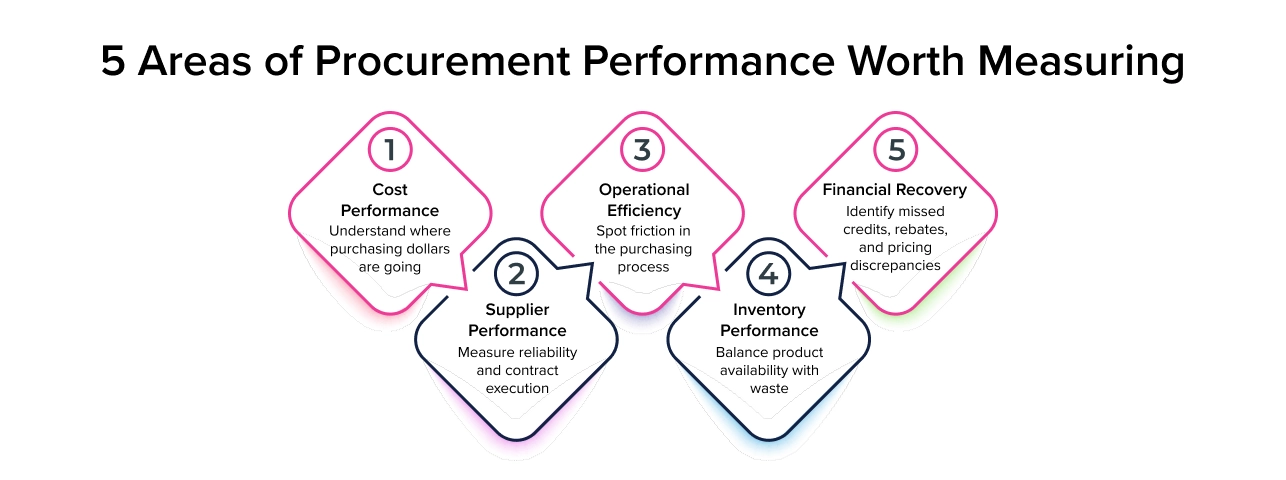
Procurement KPIs That Measure Cost Performance
Cost is usually one of the first areas procurement teams want to measure, but total purchasing spend only tells part of the story. These procurement KPIs can provide more context around where savings are being generated and where purchasing costs may be drifting.
Cost Savings
Cost savings measures the financial impact of purchasing initiatives that directly reduce what an organization pays.
That could include negotiating a lower contract price, switching to a more cost-effective product, consolidating suppliers, or sourcing an alternative item.
Tracking savings over time helps procurement teams demonstrate the financial value of their work rather than simply reporting how much the organization purchased.
Cost Avoidance
Cost avoidance looks at expenses the organization prevented rather than dollars directly removed from current spend.
For example, a procurement team may negotiate against a proposed price increase or identify an alternative product before costs rise. The organization may still be spending the same amount, but it avoided paying more.
Keeping cost savings and cost avoidance separate provides a more accurate picture of procurement performance.
Purchase Price Variance
Purchase price variance compares what an organization expected to pay for an item with what it actually paid.
In foodservice, that difference matters.
A contracted product may be invoiced at the wrong price. A substitution may come with a different cost. Commodity movement may change pricing. Locations may also purchase outside of an established agreement.
Monitoring purchase price variance helps procurement teams investigate those differences rather than allowing them to disappear inside total food spend.
Spend Under Management
Spend under management measures how much of an organization’s purchasing is actively governed by procurement processes, negotiated contracts, approved suppliers, or purchasing programs.
The more spend that falls outside those channels, the harder it can be to control costs and understand purchasing behavior.
For multi-unit foodservice organizations, this KPI can also help uncover locations or categories where purchasing has drifted away from established programs.
Procurement KPIs for Measuring Supplier Performance
A low price doesn’t mean much if a supplier can’t consistently deliver what the operation needs.
Supplier-focused procurement KPIs help teams look beyond price and evaluate the service that comes with it.
Supplier Defect Rate
Supplier defect rate measures how often products arrive damaged, incorrect, below specification, or otherwise unusable.
Repeated quality problems can create waste, disrupt operations, and force teams to find replacements at the last minute.
Tracking defect rates by supplier can help procurement teams identify recurring issues and determine when corrective action may be needed.
Contract Compliance
Contract compliance measures whether purchasing activity follows the terms of negotiated agreements.
That can include agreed-upon products, pricing, suppliers, and purchasing requirements.
Low compliance may point to several different issues. Locations may be buying off contract, approved products may not be available, or contract terms may not be reflected correctly in purchasing activity.
Understanding why compliance is low is just as important as measuring it.
Supplier Fill Rate
Supplier fill rate measures the percentage of ordered products a supplier successfully delivers.
When fill rates drop, operators may have to accept substitutions, make emergency purchases, or adjust menus and production plans.
Monitoring fill rate over time can reveal whether shortages are isolated incidents or part of a larger supplier performance problem.
Supplier Lead Time
Supplier lead time tracks how long it takes between placing an order and receiving it.
Consistent lead times make planning easier. Unpredictable lead times can create inventory problems and increase the likelihood of rush orders or stockouts.
For procurement teams, this KPI can be especially helpful when comparing suppliers or evaluating whether current ordering schedules still make sense.
Procurement KPIs That Measure Operational Efficiency
Procurement performance isn’t only about what an organization pays. It’s also about how efficiently products move from an order request to the operation.
These procurement KPIs can help identify unnecessary delays and purchasing habits that create additional work or expense.
On-Time, In-Full (OTIF) Delivery
OTIF measures whether an order arrived when promised and contained everything that was ordered.
A supplier can technically make an on-time delivery and still leave the operation scrambling if half the order is missing. OTIF combines both pieces into one measurement.
For foodservice operators, strong OTIF performance supports better inventory planning and reduces the need for last-minute substitutions or purchases.
Purchase Order Cycle Time
Purchase order cycle time measures how long it takes a purchase order to move through the procurement process.
Long cycle times may point to approval bottlenecks, manual processes, communication gaps, or other inefficiencies.
The goal isn’t necessarily to make every purchase happen faster. It’s to understand where unnecessary delays are occurring and whether they are affecting the operation.
Emergency Purchase Rate
Emergency purchases happen. A delivery is short, demand jumps unexpectedly, or a critical item simply isn’t available.
But when emergency purchases become routine, there may be a bigger issue.
Tracking the percentage of purchases made outside the normal process can help uncover problems with forecasting, inventory levels, supplier performance, or ordering practices.
Inventory KPIs That Support Better Procurement Decisions
Procurement and inventory are closely connected. Purchasing teams need enough product to support the operation without tying up unnecessary cash or creating excess waste.
These inventory-related procurement KPIs can help teams find that balance.
Inventory Turnover
Inventory turnover measures how quickly inventory is used and replaced during a given period.
A very low turnover rate may indicate excess inventory or slow-moving products. A very high rate could mean the operation is running too lean and risking stockouts.
The right target will vary by category and operation, especially in foodservice where shelf life matters.
Inventory Waste
Inventory waste measures product that is purchased but never generates value for the operation.
Spoilage, over-ordering, poor storage, incorrect forecasting, and menu changes can all contribute.
Connecting waste information back to purchasing behavior can help procurement teams make better decisions about quantities, pack sizes, ordering frequency, and product selection.
Foodservice Procurement KPIs Beyond Traditional Metrics
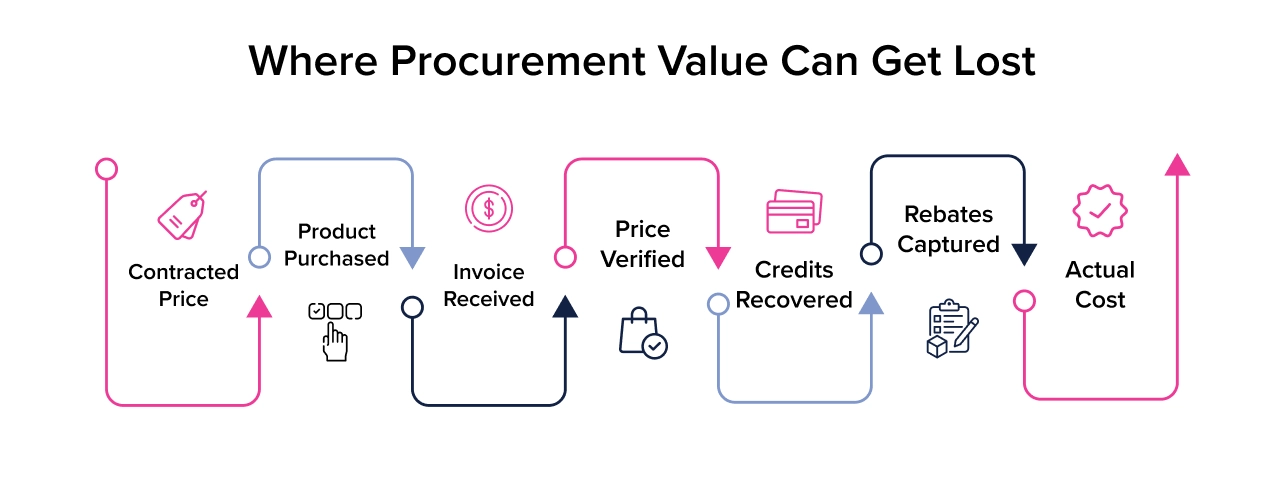
Some of the most useful procurement KPIs in foodservice are the ones that get closer to what is actually happening between a contract, an invoice, and the final cost paid by the operation.
Invoice Price Accuracy
A negotiated price only creates value when the correct price makes it onto the invoice.
Invoice price accuracy measures how often invoiced prices match the prices an organization expects to pay.
Even small discrepancies can become meaningful when they happen repeatedly across high-volume products or multiple locations. Monitoring invoice accuracy gives procurement teams a way to catch those issues instead of assuming contracted pricing is being applied correctly.
Credits Recovered
Incorrect pricing, shortages, damaged products, returns, and other discrepancies may result in money owed back to the organization.
Tracking credits recovered helps procurement teams understand how much money is being identified and returned.
It can also expose recurring issues. If the same supplier, item, or location generates frequent credits, there may be a process problem worth investigating.
Rebate Capture Rate
For organizations participating in rebate programs, earning a rebate and actually capturing it are two different things.
Rebate capture rate measures how much eligible purchasing activity is successfully generating expected rebate value.
Low capture can point to off-contract purchasing, product eligibility issues, missing purchasing data, or other gaps that deserve a closer look.
Food Cost Variance
Food cost variance helps operators compare expected food costs with actual results.
When the two begin moving apart, procurement data can provide clues about why.
Price changes, purchasing behavior, product substitutions, waste, and other factors may all contribute. Looking at food cost variance alongside other procurement KPIs gives teams a better chance of finding the actual source of the change.
How to Build a Procurement KPI Dashboard That Drives Better Decisions
A procurement KPI dashboard should make purchasing performance easier to understand, not give your team another screen full of numbers to decipher.
Start with the KPIs tied most closely to the organization’s current priorities. Group related metrics together so users can quickly understand cost performance, supplier performance, operational efficiency, and inventory.
Context matters, too.
Seeing that purchase price variance increased this month is useful. Being able to determine which suppliers, products, categories, or locations caused the increase is much more useful.
That’s where procurement technology can make a difference.
InsideTrack brings purchasing information together to give foodservice organizations greater visibility into spend, pricing, supplier activity, contracts, and purchasing behavior. Instead of piecing together information from invoices, distributor reports, spreadsheets, and separate systems, procurement teams can more easily get to the details behind their numbers.
The best dashboard isn’t necessarily the one with the most data. It’s the one that helps your team figure out what needs attention next.
What Procurement KPI Benchmarks Should You Aim For?
This is one area where generic benchmarks can get foodservice organizations into trouble.
A good procurement KPI target depends on the metric, category, supplier relationship, business model, and starting point of the organization.
A 95% fill rate, for example, doesn’t mean much without context. Is it an improvement over last quarter? Are critical items consistently among the missing 5%? Is another supplier performing better in the same category?
The same applies to price variance, inventory turnover, contract compliance, and other procurement KPIs.
Rather than chasing a universal number, establish a baseline using your own purchasing data. Then look at performance over time.
Set targets that make sense for the organization and revisit them as purchasing conditions change. When outside benchmarks are available and relevant, they can add useful context, but they shouldn’t replace what your own data is telling you. For a closer look at how procurement benchmarking can sharpen your pricing strategy, compare item-level spend, and strengthen supplier negotiations, see our guide on Procurement Benchmarking: Key to More Profitable Purchasing Decisions.
Using Procurement KPIs to Drive Continuous Improvement
Procurement KPIs are only valuable if someone does something with them.
A dashboard that gets opened once a quarter and forgotten isn’t going to change purchasing performance. The real value comes from regularly reviewing the numbers, asking what changed, and deciding what needs attention.
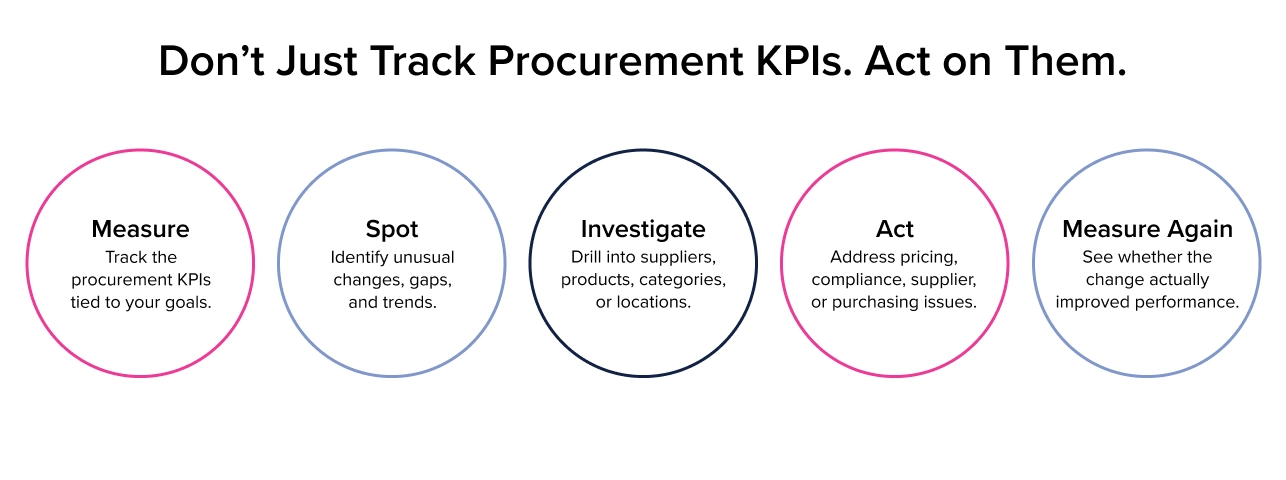
Maybe invoice price accuracy suddenly drops for one distributor. Maybe a category starts showing more purchase price variance. Maybe one location has an unusually high emergency purchase rate. Those are signals worth investigating.
Over time, procurement KPIs can also help teams see whether changes are working.
If a new contract is supposed to improve pricing, measure it. If a supplier agrees to address fill-rate problems, keep watching the numbers. If locations are asked to improve contract compliance, track whether purchasing behavior actually changes.
InsideTrack helps foodservice organizations turn purchasing data into information teams can use to protect margins, improve compliance, uncover savings opportunities, and make more informed procurement decisions.
FAQs
What Are Procurement KPIs?
Procurement KPIs are measurements used to evaluate purchasing performance. They can track areas such as costs, supplier performance, contract compliance, purchasing efficiency, inventory, rebates, and invoice accuracy.
What’s the difference between a KPI and a metric?
A metric measures an activity or result. A KPI is a metric specifically tied to an important business objective. In other words, teams can track plenty of procurement metrics, but the most important ones become procurement KPIs.
Which procurement KPIs matter most?
It depends on the organization’s goals. Common procurement KPIs include cost savings, purchase price variance, contract compliance, supplier fill rate, OTIF delivery, spend under management, invoice price accuracy, and rebate capture rate.
How many procurement KPIs should an organization track?
There isn’t a universal number. Focus on a manageable set of procurement KPIs tied to the decisions your team actually needs to make. If a KPI isn’t informing an action, it may not need a prominent place on the dashboard.
How often should procurement KPIs be reviewed?
The right cadence depends on the KPI. Pricing, supplier performance, and purchasing exceptions may warrant frequent review, while broader trends can be evaluated monthly or quarterly. The important thing is reviewing the data often enough to act before a small issue becomes an expensive one.
What is a good purchase price variance?
There is no single purchase price variance that is good for every organization. Teams should compare actual pricing against their expected or contracted pricing, establish a baseline, and investigate meaningful deviations rather than relying on one universal benchmark.
What does spend under management mean?
Spend under management is the portion of an organization’s purchasing that is actively managed through established procurement processes, contracts, approved suppliers, or purchasing programs.
How do procurement KPIs differ in foodservice?
Foodservice procurement KPIs have to account for challenges such as changing food prices, perishability, substitutions, distributor relationships, rebates, contract pricing, inventory waste, and high purchasing volume. That makes granular purchasing data especially important when evaluating performance.